The Mitosius
Creating the Mitosius is the last preparation step before the reconstruction. This section covers how to prepare the mitosius.
You have already run the coil sensitivity estimation or had an estimate of coil sensitivity by your own procedure (see the Coil Sensitivity Map Estimation). You need to have access to the raw data of the acquisition (of course :)).
This script is designed to process Siemens raw MRI data/ISMRMRD using various monalisa functions to load raw data, initialize parameters, compute trajectory points and volume elements, normalize the data, and generate the output “mitosius”. The resulting mitosius contains raw data, the computed trajectory and the volume elements for each bin.
Important
Keep in mind that the trajectory must be supported by the toolbox; alternatively, you can define and implement a custom trajectory following our suggestion at the end of the section (see the section Custom Trajectories).
Prerequisites
Ensure you have the following files and paths correctly set up:
Siemens raw data file. (Or ISMRMRD file)
Precomputed coil sensitivity matrix (C.mat).
Precomputed binning mask (Mask.mat)
Additionally, monalisa must be installed with the raw-data readers (pip install -e ".[io]", see Installation). The examples below assume
import numpy as np
import scipy.io as sio
import monalisa as ml
from monalisa.io import loadmat73
Tip
In MATLAB, the help function bmTwix_info inspects the acquisition parameters of a 3D radial raw data file. It is not part of the recon procedure and is not ported to Python: in Python, the reader created below prints its parameters with print(reader.acquisitionParams).
Usage instructions
Define the Paths
# Paths - Replace for your own case
f = "/your/path/to/raw_data/rawdata.dat"
CMatPath = "/your/path/to/C/C.mat"
MaskPath = "/your/path/to/Mask/Mask.mat"
mitosiusPath = "/your/path/to/save/mitosius/"
Load the Raw Data
autoFlag = False  # Set whether the validation UI is shown
# Create the appropriate reader based on the file extension
reader = ml.create_raw_data_reader(f, autoFlag)
In our examples, we often use 3D radial trajectory. In that case, the raw data reader will check the first segment of each shot to estimate after how many nLines, steady state is reached. For your own trajectory, you can find your own way.
(The image title is yet to change. The screenshots on this page are from MATLAB; the Python windows show the same information.)
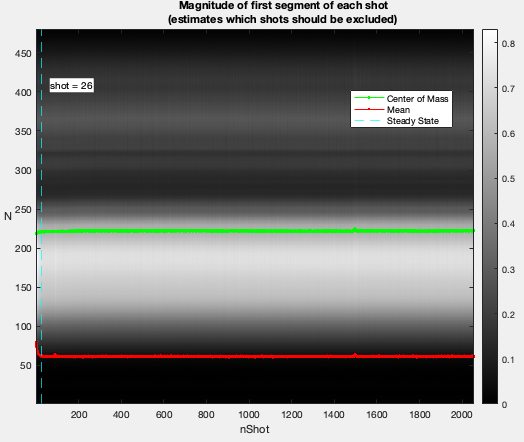
The acquisition parameters will be extracted automatically, if possible.
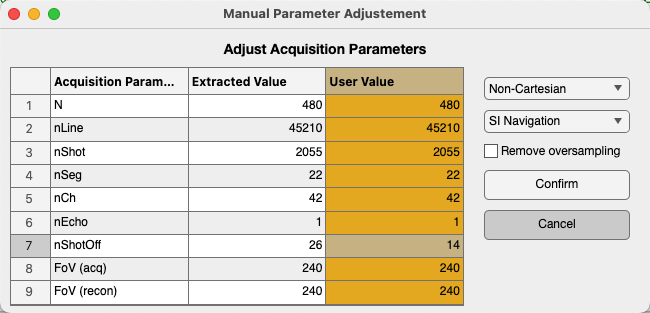
You can also modify the parameters manually in the “User Value” column (in yellow), for example: adjusting nShotOff according to your needs. If you want to include all the lines for reconstruction, set nShotOff = 0. Then click the “Confirm” button.
With autoFlag = True no window is shown, and the parameters can be changed in the code instead, for example reader.acquisitionParams.nShot_off = 0.
Add MRI Acquisition Parameters
Save the acquisition parameters into p and add other parameters you may need.
p = reader.acquisitionParams
p.selfNav_flag = True
p.traj_type = "full_radial3_phylotaxis"

# Initialize and fill in the parameters:
# p.raw_N_u: acquisition matrix size (identified from your acquisition protocol)
p.raw_N_u = np.array([[480, 480, 480]])             # optional, just for records
p.raw_dK_u = np.array([[1.0, 1.0, 1.0]]) / 480      # optional, just for records
Read the raw data and compute trajectory points, volume elements
# Read raw data
# get raw data without nshotoff and SI
flagSS = True
flagExcludeSI = True
# flagSS: if true, filter out the non steady state shots
# flagExcludeSI: if true, filter out the SI projections
y_tot = reader.read_raw_data(flagSS, flagExcludeSI)

# compute trajectory points
# get 'full_radial3_phylotaxis' trajectory without nshotoff and SI
t_tot = ml.traj(p)
# alternatively you can compute your own trajectory
# more details in "Custom Trajectories"

# compute volume elements (3D full radial trajectory in this case)
ve_tot = ml.volume_element(t_tot, "voronoi_full_radial3")
Load the Coil Sensitivity Matrix
Resize the coil sensitivity matrix to match the reconstruction matrix size.
Tip
Here we want to clarify the distinction of the concepts between “Reconstruction matrix size” and “Acquisition matrix size”
Acquisition matrix size: This refers to the matrix size specified by the acquisition protocol. It was already set at the acquisition step by the experimenters.
Reconstruction matrix size Matrix_size: This is set by the user based on the desired resolution of reconstructed images, i.e. the size of the reconstructed image.
N_u: The size of reconstruction grid in Fourier space. For example, we can set N_u = Matrix_size.
\(N_u = [N_x, N_y, N_z]\)
n_u: The size of reconstruction in image space. It is possible to set n_u ≤ N_u. However, we recommend setting n_u = N_u for achieving the optimal image quality.
\(n_u = [n_x, n_y, n_z]\)
- dK_u: The step size of the grid in Fourier space, calculated as dK_u = 1/Fov.
\(dK_u = [dK_x, dK_y, dK_z]\)
C = loadmat73(CMatPath)["C"]  # a -v7.3 file, as written by monalisa; else sio.loadmat(CMatPath)["C"]
# N: reconstruction matrix size
N_u = np.array([[N, N, N]], dtype=np.float64)
n_u = N_u
dK_u = np.array([[1.0, 1.0, 1.0]]) / FoV
C = ml.im_resize(C, [48, 48, 48], N_u)
Normalize the data
Normalize the raw data by the average value of a region of interest (ROI). The goal is to adjust the intensity values of the image so that they are centered around a mean of 1 in the ROI.
Important
Keep in mind that whether or not normalization is applied, the regularization weight in the final reconstruction step should be adjusted accordingly. Our normalization helps standardize the regularization weight.
x_tot = ml.mathilda(y_tot, t_tot, ve_tot, C, N_u, n_u, dK_u)
ml.show_image(x_tot)
temp_im = np.abs(x_tot[:, :, N // 2])  # the slice to draw the ROI on (MATLAB: the displayed one)
temp_roi = ml.roipoly(temp_im)
Here an estimation of the reconstructed image will be shown and you can select the ROI based on it.
We selected the left eye globe as the ROI in our example below, you can also select yours with a larger area in the brain.
Left Click: Adds a vertex at the clicked position.
Click on the first vertex: Completes the polygon and closes it (MATLAB: right click or double click). The vertices can then be moved; press “Confirm”.
The vertices are printed, so that the same ROI can be rebuilt later without the window:
ml.roipoly(temp_im, c, r) with the printed column and row coordinates.
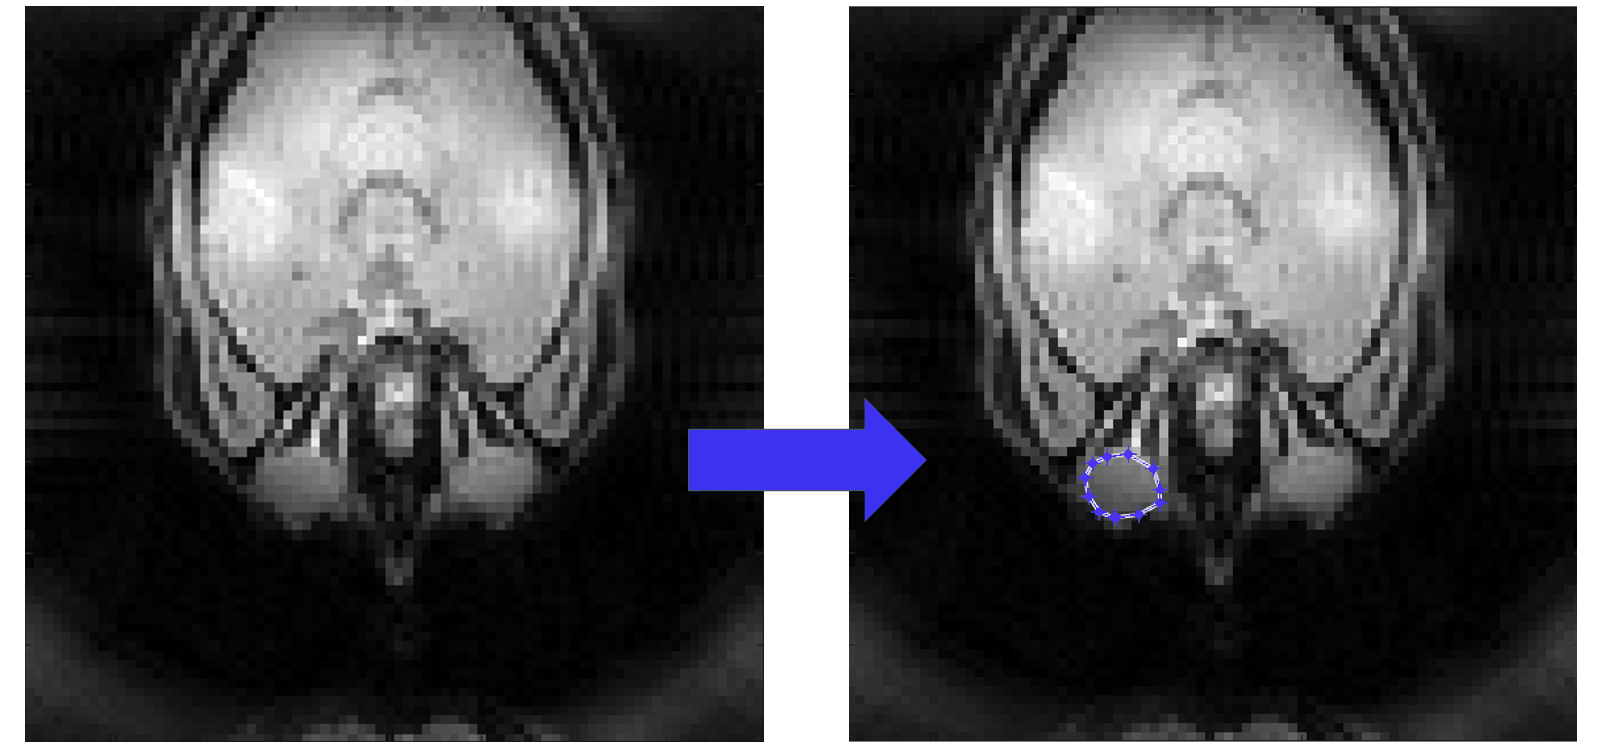
normalize_val = np.mean(temp_im[temp_roi])
# normalize it only once
y_tot = y_tot / normalize_val
Cleaning of the mask
For some trajectories, such as the 3D radial trajectory, it is necessary to clean the SI projection and remove the first unsteady shots from the acquired readouts. Therefore, we also need to clean the binning mask accordingly to ensure that the size of Mask matches the size of y_tot.
Mask = sio.loadmat(MaskPath)["Mask"].astype(bool)  # MATLAB logical arrays are loaded as uint8
Mask = np.reshape(Mask, (20, 22, 2055), order="F")  # column-major, as MATLAB reshape
# before cleaning, the size of Mask: [nBin, nSeg, nShot]
Mask = Mask[:, 1:, :]
Mask = Mask[:, :, int(p.nShot_off):]
# after cleaning, the size of Mask: [nBin, nSeg-1, nShot-p.nShot_off]
Mask = ml.point_reshape(Mask)
# after the reshape, the size of Mask: [nBin, nLines]
# where nLines=(nSeg-1)*(nShot-p.nShot_off)
Compute Final Data Structures for Reconstruction
Run the mitosis function and compute the final volume elements.
y, t = ml.mitosis(y_tot, t_tot, Mask, nargout=2)
y = ml.permute_to_col(y)
ve = ml.volume_element(t, "voronoi_full_radial3")
Save the Results
Save the computed data structures to disk. These will be used for the final reconstruction.
ml.mitosius_create(mitosiusPath, y, t, ve)
The mitosius is a folder of MATLAB -v7.3 files: a mitosius written by Python can be loaded by MATLAB’s bmMitosius_load, and the reverse.
Notes
Ensure all paths are correctly set according to your system.
If you encounter issues with reading the raw data, verify that monalisa is installed with the raw-data readers (
pip install -e ".[io]").The raw data normalization step ensures that the average value in the selected ROI ranges around the mean of 1 in the reconstructed images. This allows the standardization of the regularization weights.