Tutorial 1: Reconstruct MRI rawdata
Welcome to this tutorial! In this guide, we will use Monalisa to reconstruct MRI raw data. In this tutorial we will work with some 3D radial brain data. This tutorial aim to give you a first good experience with the toolbox, providing you with all the essential information to reconstruct your own data. We’ll start with a set of files:
A brain scan dataset (the main scan).
- Two prescans for coil sensitivity estimation:
A body coil prescan.
A head coil prescan.
A Jupyter notebook and a Python script are provided to help us produce images step by step. The reconstruction process involves multiple steps illustrated in the figure below, in this tutorial we will walk you through each of them.
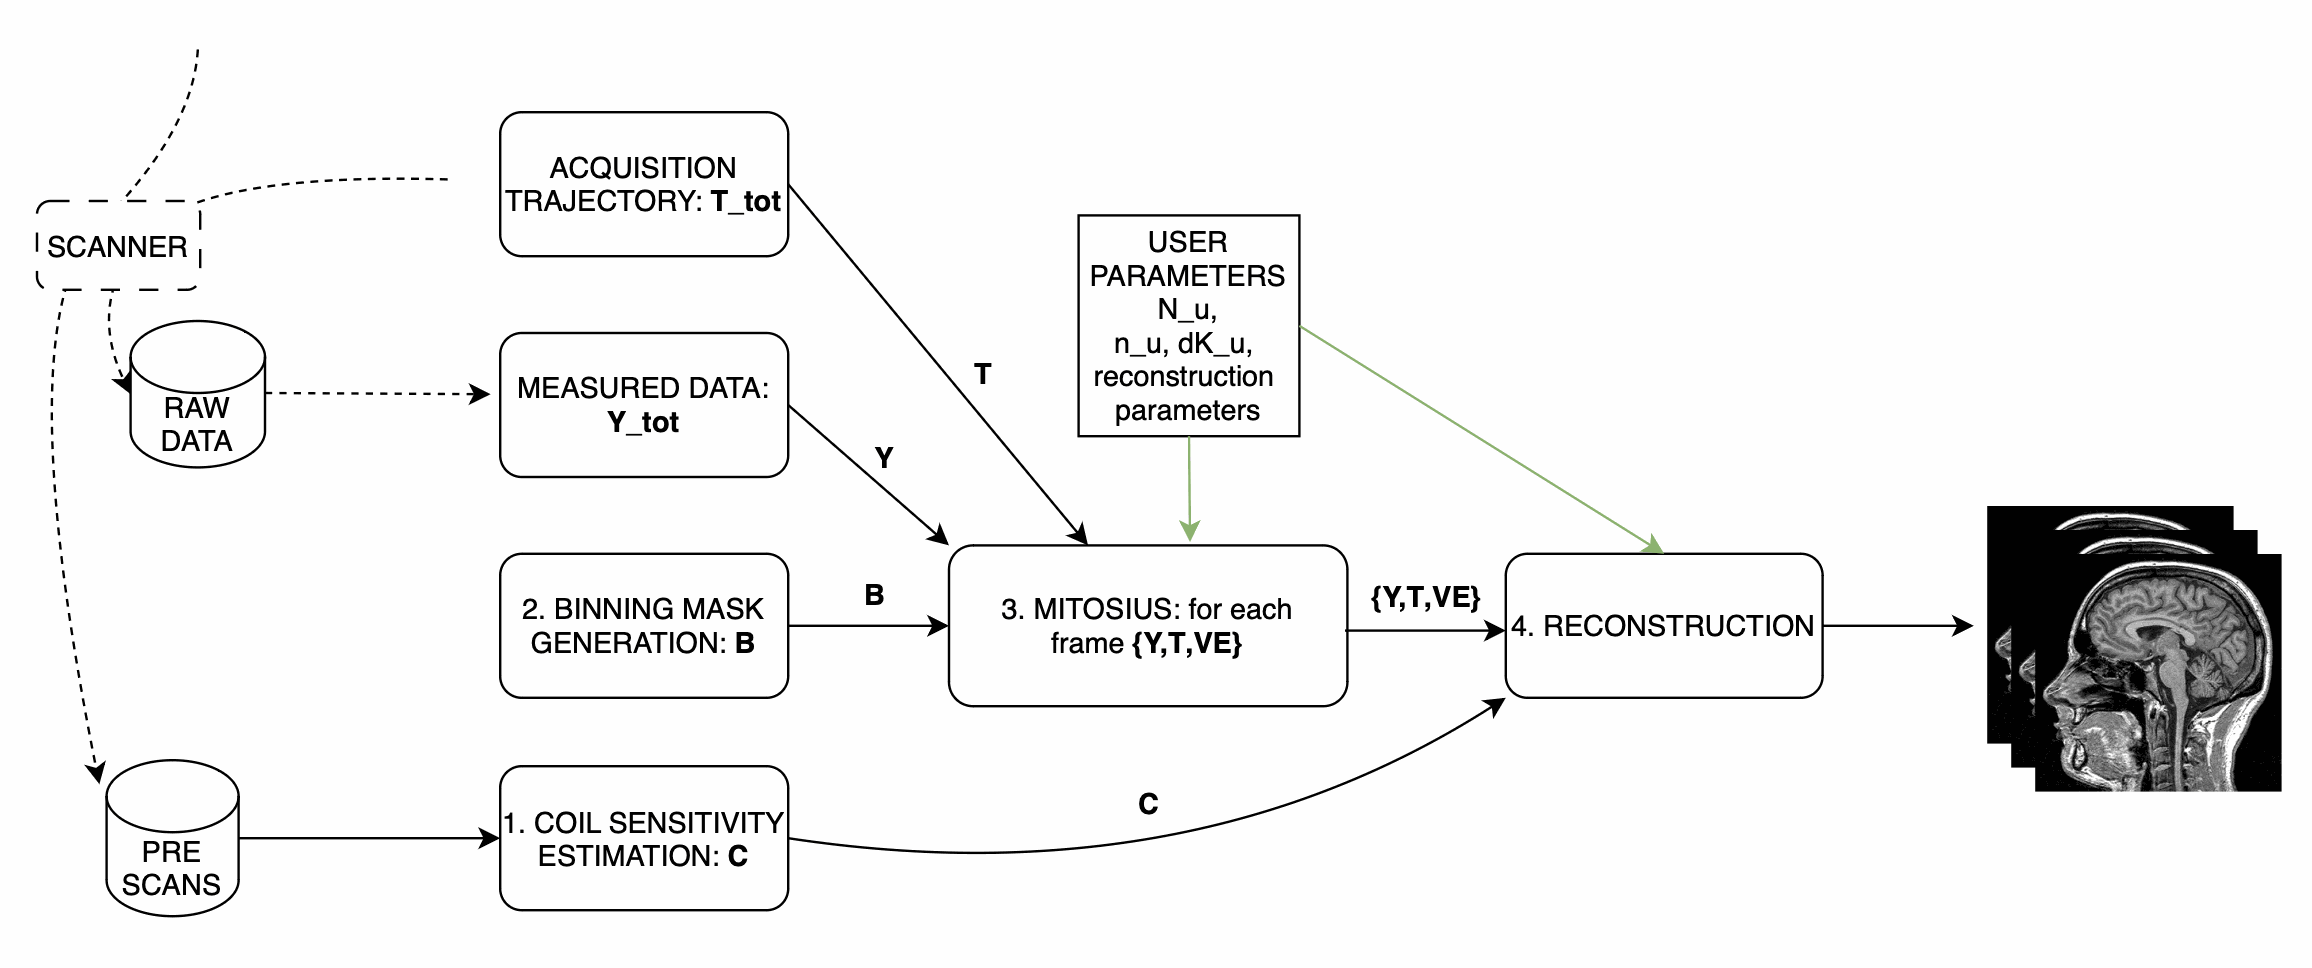
For this tutorial the repository is organized as follows:
monalisa-python/
├── examples/tutorial_1/
│   ├── tutorial_1.ipynb  # the tutorial, step by step, with figures
│   ├── tutorial_1.py     # the same steps as a script
│   └── results/          # written by the tutorial
├── demo/data_demo/data_8_tutorial_1/
│   ├── download_data.py  # downloads the data below
│   ├── bodyCoil.dat      # this is the body coil prescan
│   ├── brainScan.dat     # this is the actual brain data
│   └── surfaceCoil.dat   # this is the brain coil prescan
To start working on this tutorial, and get the needed data you need to:
If you haven’t done it already, you fist need to follow the installation guidelines (Installation, with the io and notebook extras, or Running Monalisa in Docker).
Download the data needed for tutorial 1, this can take a while depending on your internet connection (about 7.9 GB), and can be done with the download_data.py script:
# Execute the script: Download the data
python demo/data_demo/data_8_tutorial_1/download_data.py
You are now ready to follow the tutorial, in the notebook:
jupyter lab examples/tutorial_1/tutorial_1.ipynb
or with the script (--interactive opens the same windows as the MATLAB scripts, --show shows the results):
python examples/tutorial_1/tutorial_1.py --data demo/data_demo/data_8_tutorial_1 --out results
The code below is the code of the notebook. It assumes
import os
from pathlib import Path

import matplotlib.pyplot as plt
import numpy as np

import monalisa as ml
from monalisa.io import loadmat73, savemat73

DATA = Path(os.environ.get("MONALISA_TUTORIAL_DATA", "../../demo/data_demo/data_8_tutorial_1"))
OUT = Path("results")  # results of every step are saved here
OUT.mkdir(exist_ok=True)
Step 1: Compute Coil Sensitivity
The first step is to compute coil sensitivity maps, which describe how each coil “sees” the object being scanned.
The only parameter you can adjust is the virtual Cartesian grid size (N_u). In MATLAB, some pop-up windows ask you to confirm the acquisition parameters (which are already correct), and to select a box around the brain;
the notebook uses autoFlag=True instead (no window), and sets in the code the two corrections that the MATLAB tutorial makes in its dialogs: the same number of discarded shots (nShot_off) for both scans, and the trajectory type.
Note
We recommend setting N_u between 48 and 96 for optimal results.
Script Overview:
Below is the main structure of the coil sensitivity estimation:
# Create raw data readers
bodyReader = ml.create_raw_data_reader(DATA / "bodyCoil.dat", True)
surfaceReader = ml.create_raw_data_reader(DATA / "surfaceCoil.dat", True)
nShotOff = max(bodyReader.acquisitionParams.nShot_off, surfaceReader.acquisitionParams.nShot_off)
for r in (bodyReader, surfaceReader):
    r.acquisitionParams.nShot_off = nShotOff
    r.acquisitionParams.traj_type = "full_radial3_phylotaxis"

# Cartesian grid spacing (dK_u) and grid size (N_u)
dK_u = np.array([[1.0, 1.0, 1.0]]) / surfaceReader.acquisitionParams.FoV
N_u = np.array([[48.0, 48.0, 48.0]])  # Adjust this value as needed

# Compute Coil Sensitivity

# 1. get low resolution data from the prescan files
y_body, t, ve = ml.coil_sense_non_cart_data(bodyReader, N_u)
y_surface = ml.coil_sense_non_cart_data(surfaceReader, N_u, nargout=1)

# 2. estimate gridding matrix
Gn, Gu, Gut = ml.traj_to_sparse_mat(t, ve, N_u, dK_u)
# 3. We compute a binary mask to enhance our estimation
# This mask should optimally only contain the whole imaged region
mask = ml.coil_sense_non_cart_mask_automatic(y_body, Gn, True)

# Estimate Coil Sensitivity
# Reference coil sensitivity using the body coils. This is used as
# a reference to estiamte the sensitivity of each head coil
y_ref, C_ref = ml.coil_sense_non_cart_ref(y_body, Gn, mask, None)
# Head coils sensitivities estimation using body coil reference
C_prime = ml.coil_sense_non_cart_primary(y_surface, y_ref, C_ref, Gn, ve, mask)

# Refine the coil sensitivity estimation
nIter = 5
C = ml.coil_sense_non_cart_secondary(y_surface, C_prime, y_ref, C_ref, Gn, Gu, Gut, ve, nIter, False)

# Save Results
savemat73(OUT / "coil_sensitivity_map.mat", {"C": C})
This script performs three main function calls:
Compute a binary mask A binary mask,
mask, is generated to filter out the contribution of noisy voxels from the estimation process.Calculate reference coil sensitivity The body coil is used to calculate a reference coil sensitivity, which is an intermediate step in our computation.
Compute individual coil sensitivities Using the reference coil sensitivity, the script computes the individual coil sensitivities first estimate C_prime.
- Compute refined individual coil sensitivities
C_prime is further refined using an iterative optimization process.
After running the script, you can take a look at the generated maps, for instance with ml.show_image(C). These maps represent how different coils perceive the imaging field.
They are saved into a file that we will use during the reconsturctions.
Step 2: Binning
Binning is highly related to the study design. In the following we illustrate several very different binning strategies in increasing difficulty level. The binnings need the acquisition parameters of the brain scan:
reader = ml.create_raw_data_reader(DATA / "brainScan.dat", True)
p = reader.acquisitionParams
nSeg, nLines = int(p.nSeg), int(p.nLine)
nExcludeMeasures = int(p.nShot_off) * nSeg
ts = np.ravel(np.asarray(p.timestamp, dtype=np.float64))
timestampMs = (ts - ts.min()) * 2.5  # Siemens time stamps are in units of 2.5 ms
si = np.arange(0, nLines, nSeg)      # first line of every shot (SI projection)
Step 2.1: allLines Binning - A Single Bin
The first binning strategy we will use is allLines binning, which groups all usable lines into a single bin. This is the simplest form of binning and serves as a baseline for more advanced strategies.
Purpose: The goal of this step is to include all lines that are in the steady-state phase and exclude:
Non-steady-state lines: These occur during the initial acquisition phase before the steady-state phase is reached.
SI projection lines: Repeated measurements at the same spatial location (e.g., 1 line every nSeg = 22).
Script Overview: We start by initializing a mask that includes all lines, excluding those that cannot be used for reconstruction. Here’s the Python implementation:
# Step 2: Simple Binning - Include All Steady-State Lines
# Create a mask with all lines that are in steady state
# (excluding the first few lines which may be non-steady-state)
nbins = 1
allLines = np.ones((nbins, nLines), dtype=bool)  # Include all lines except non steady state

# Exclude non-steady-state lines
allLines[0, :nExcludeMeasures] = False

# Exclude repeated SI projection lines
allLines[0, si] = False
Visualization: To better understand the generated mask, we plot the binning mask. Different categories of points are displayed:
Red Points: Non-steady-state lines.
Orange Points: SI projection lines.
Green Points: Steady-state lines included in the bin.
# Visualize the Binning Mask
timeInSeconds = timestampMs / 1000
i = np.arange(nLines)
red = i < nExcludeMeasures                # not steady state
orange = ~red & (i % nSeg == 0)           # SI projection
green = ~red & ~orange

fig, ax = plt.subplots()
ax.scatter(timeInSeconds[orange], allLines[0, orange], 40, color=(1, 0.647, 0), label="SI point (Orange)")
ax.scatter(timeInSeconds[red], allLines[0, red], 40, color="r", label="Not steady-state points (Red)")
ax.scatter(timeInSeconds[green], allLines[0, green], 40, color="g", label="Other points (Green)")

# Add labels and title
ax.set_xlabel("Time (s)")
ax.set_ylabel("Logical Mask Values (0 = exclude)")
ax.set_title("allLine Binning Mask (4.15s to 5s)")
ax.grid(True)
ax.set_ylim(-0.1, 1.1)  # Binary y-axis
ax.set_xlim(4.15, 5)    # Limit x-axis to the specified time range
ax.set_xticks(np.arange(4.15, 5.001, 0.05))  # Adjust tick density within the range
ax.legend(loc="best")
plt.show()
Interpretation of the Plot:
Red Points: Indicate non-steady-state lines that are excluded from reconstruction.
Orange Points: Represent SI projection lines, excluded due to redundancy.
Green Points: Indicate steady-state lines included in the reconstruction.
Output: The mask generated in this step groups all steady-state lines into a single bin. This mask will be used as a reference for comparison in subsequent steps.
Step 2.2: Sequential Binning - 5-Second Temporal Bins
The purpose of this step is to group the measured data into fixed temporal bins of 5 seconds each. This approach allows for systematic segmentation of the dataset while excluding non-steady-state measurements. Below are the details of the process:
Temporal Window Definition
The temporal window for each bin is set to 5 seconds, defined as:
temporalWindowSec = 5
temporalWindowMs = temporalWindowSec * 1000
Data is processed within this window size, converting the time to milliseconds for consistency with the timestamp measurements.
Exclude Non-Steady-State Measurements
Non-steady-state measurements, such as the first few “off-shots” or specific artifacts, are excluded by adjusting the start time:
startTime = timestampMs[nExcludeMeasures]  # first steady state line (0-based index)
endTime = timestampMs[-1]
The startTime ensures that the initial excluded data points are not considered during binning.
Binning Mask Creation
The number of temporal bins (nMasks) is calculated based on the duration of valid data and the size of the temporal window:
totalDuration = endTime - startTime
nMasks = int(np.floor(totalDuration / temporalWindowMs))
An empty logical matrix (sequentialBinningMask) is initialized to store inclusion/exclusion information for each bin.
Filling the Binning Mask
For each bin, a mask is created to identify which measurements fall within the temporal window. This mask is then adjusted to exclude specific lines (e.g., SI projections or other artifacts) based on predefined rules.
sequentialBinningMask = np.zeros((nMasks, nLines), dtype=bool)
for i in range(nMasks):
    windowStart = startTime + i * temporalWindowMs
    windowEnd = windowStart + temporalWindowMs

    mask = (timestampMs >= windowStart) & (timestampMs < windowEnd)

    mask[si] = False  # exclude the SI projection lines

    sequentialBinningMask[i, :] = mask

savemat73(OUT / "binning.mat", {"allLinesMask": allLines, "sequentialMask": sequentialBinningMask})
The notebook shows the temporal binning masks as an image (one row per bin), with plt.imshow(sequentialBinningMask, aspect="auto").
Step 3: Preparing the Data for Reconstruction (Mitosius)
This step organizes the data into the correct format for the reconstruction algorithm. The key tasks in this stage include:
Loading the raw brain scan data.
Computing trajectories and volume elements.
Normalizing the data.
Selecting a binning strategy.
Mitosius Script Overview
Below is a streamlined script for the Mitosius step. It prepares the data for reconstruction by leveraging previously computed coil sensitivity maps and binning masks.
# Load Raw Data and Compute Trajectories
p.traj_type = "full_radial3_phylotaxis"
y_tot = reader.read_raw_data(True, True)
t_tot = ml.traj(p)
ve_tot = ml.volume_element(t_tot, "voronoi_full_radial3")

FoV = float(np.ravel(p.FoV)[0])
N = int(FoV / 3)  # 3 mm voxels
N_u = np.array([[N, N, N]], dtype=np.float64)
dK_u = np.array([[1.0, 1.0, 1.0]]) / FoV
C_N = ml.im_resize(C, [48, 48, 48], N_u)  # coil maps at the image resolution

# Normalize the Data
x_tot = ml.mathilda(y_tot, t_tot, ve_tot, C_N, N_u, N_u, np.array([[1.0, 1.0, 1.0]]) / 384)
temp_im = np.abs(x_tot[:, :, N // 2])
temp_roi = ml.roipoly(temp_im)  # draw the ROI; the notebook uses a centered disk instead
normalize_val = np.mean(temp_im[temp_roi])
y_tot = y_tot / normalize_val

# Apply Mitosis, for each binning strategy
nShot_off = int(p.nShot_off)
for name, mask in {"allLines": allLines, "sequential": sequentialBinningMask}.items():
    m = np.reshape(mask, (mask.shape[0], nSeg, mask.shape[1] // nSeg), order="F")
    m = m[:, 1:, nShot_off:]  # drop the SI line and the discarded shots, as the raw data
    m = ml.point_reshape(m)
    y, t = ml.mitosis(y_tot, t_tot, m, nargout=2)
    y = ml.permute_to_col(y)
    ve = ml.volume_element(t, "voronoi_full_radial3")
    ml.mitosius_create(str(OUT / f"mitosius_{name}"), y, t, ve)
(As in the MATLAB tutorial, the normalization image is gridded with dK_u = 1/384.)
Choosing a Binning Strategy
The MATLAB script includes a pop-up window allowing the user to choose between the AllLines and Sequential binning strategies; the Python code prepares both, one after the other:
AllLines Binning: Groups all steady-state lines into a single bin.
Sequential Binning: Groups the data into temporal bins of 5 seconds.
The appropriate binning mask is applied to the data, preparing it for reconstruction. Both binnings are prepared, to be able to reconstruct both. The processed data is saved in the mitosius_allLines and mitosius_sequential directories. This output is now ready for use in the next step: Reconstruction.
The normalization region drawn with roipoly makes the result depend on the drawing. To be reproducible, the notebook (and the script, without --interactive) uses a fixed region instead, a centered disk of radius N/4 in the central slice:
gx, gy = np.meshgrid(np.arange(1, N + 1), np.arange(1, N + 1), indexing="ij")
temp_roi = (gx - (N / 2 + 1)) ** 2 + (gy - (N / 2 + 1)) ** 2 <= (N / 4) ** 2
Efficient Workflow: Local Preprocessing, HPC Reconstruction
A key feature of the Monalisa workflow is its ability to minimize the computational and data transfer burdens. Instead of directly transferring raw datasets to a High-Performance Computing (HPC) system, we recommend to preprocess the data locally on your laptop until the mitosius step. This approach ensures that only the essential preprocessed data is transferred, significantly reducing file size and optimizing HPC utilization.
Why This Approach?
MRI datasets are typically large, with raw data files often reaching several gigabytes. Transferring such large files to an HPC system can be time-consuming and inefficient. By running the mitosius preprocessing step locally, you can achieve the following:
Reduced Data Volume: The mitosius step processes and organizes the raw data into a streamlined format, drastically reducing its size while retaining all critical information for reconstruction.
Efficient Reconstruction: The preprocessed data is tailored for computationally intensive reconstruction algorithms, enabling faster execution on HPC systems.
Lower Costs: Fewer data transfers mean reduced network bandwidth usage, saving your time. Running the preprocessing
Workflow Summary:
Run the mitosius step locally:
Preprocess your raw data using the provided notebook or script.
Save the resulting files in a lightweight format suitable for reconstruction.
Transfer the preprocessed data to HPC, if you have one:
Use secure and efficient transfer methods (e.g., scp, rsync, or cloud-based storage) to move the smaller dataset to the HPC system.
Perform heavy reconstructions on HPC:
Use Monalisa’s advanced reconstruction algorithms (e.g., Mathilda, Sensa, compressed sensing) to generate high-quality images. The Docker image (Running Monalisa in Docker) runs the same environment there.
Download and analyze results locally:
Retrieve the reconstructed images and analyze them on your laptop or workstation.
This hybrid approach leverages the strengths of both local and HPC envsironments, providing an optimal balance between convenience and computational power.
Tip
Ensure you carefully verify the preprocessed data before transferring it to the HPC system. Small errors in the mitosius step can propagate into reconstruction, leading to suboptimal results.
By following this workflow, you can maximize efficiency and focus on obtaining the highest quality MRI reconstructions with minimal hassle.
Step 4: Running Reconstructions
Reconstruction Methods Overview
Method |
Description |
Key Parameters |
Use Case |
|---|---|---|---|
Gridded Reconstruction (Mathilda) |
Basic reconstruction using gridding. |
N_u: Grid size dK_u: Grid spacing |
Quick reconstruction for visual inspection or debugging. |
Iterative Sense Reconstruction (Sensa) |
Exploits coil sensitivity maps for improved image quality. |
C: Coil sensitivity maps nCGD: Number of conjugate gradient iterations nIter: Number of iterations. |
High-quality images with moderate computing requirements. |
Compressed Sensing (TevaMorphosia_chain) |
Reduces undersampling artifacts by temporal regularization (1 temporal dimension). |
delta: Regularization weight rho: Convergence parameter nIter: Number of iterations Tu, Tut: Deformation matrices. If not empty, motion compensaiton is performed. |
When data is undersampled and/or sparsity of temporal gradient is expected. |
Reconstruction Implementation
The final step is to reconstruct the images using various methods. First we need to load the data prepared previously:
d = str(OUT / "mitosius_allLines")
y  = ml.mitosius_load(d, "y")
t  = ml.mitosius_load(d, "t")
ve = ml.mitosius_load(d, "ve")
Then we need to decide set some parameters:
FoV = float(np.ravel(p.FoV)[0])  # Field of View
matrix_size = int(FoV / 3)        # Max nominal spatial resolution
N_u = np.array([[matrix_size] * 3], dtype=np.float64)
n_u = N_u
dK_u = np.array([[1.0, 1.0, 1.0]]) / FoV
C = loadmat73(OUT / "coil_sensitivity_map.mat")["C"]
# Adjust grid size for coil sensitivity maps
C = ml.im_resize(C, [48, 48, 48], N_u)

# For Iterative Sense
nIter = 30
witness_ind = None
nCGD = 4
ve_max = 10 * np.prod(dK_u)

# For CS recon
nIter = 30
delta = 0.1
rho = 10 * delta
witness_ind = np.arange(1, nIter + 1, 3)  # Only track one out of three steps
nCGD = 4
Finally we can run the reconstruction, many options are available:
Gridded Reconstruction (Mathilda), of the single bin of
mitosius_allLines, and of the first 8 bins ofmitosius_sequential:x0 = ml.mathilda(y[0, 0], t[0, 0], ve[0, 0], C, N_u, N_u, dK_u) nFr = 8 d = str(OUT / "mitosius_sequential") y, t, ve = (ml.mitosius_load(d, k)[:nFr] for k in ("y", "t", "ve")) x1 = [ml.mathilda(y[i, 0], t[i, 0], ve[i, 0], C, N_u, N_u, dK_u) for i in range(nFr)]
Iterative Sense Reconstruction (Sensa), frame by frame, started from the gridded images:
from monalisa.optim import WitnessInfo

Gu, Gut = ml.traj_to_sparse_mat(t, ve, N_u, dK_u, nargout=2)
x_sensa = [ml.sensa(x1[i], y[i, 0], ve[i, 0], C, Gu[i, 0], Gut[i, 0], n_u, nCGD, ve_max, nIter,
                    WitnessInfo(f"sensa_frame_{i + 1}", witness_ind)) for i in range(nFr)]
Compressed Sensing, the 8 frames together (a chain: an object array of shape
(nFr, 1)):x1_cell = np.empty((nFr, 1), dtype=object) for i in range(nFr): x1_cell[i, 0] = x1[i] x_cs = ml.teva_morphosia_chain(x1_cell, None, None, y, ve, C, Gu, Gut, n_u, None, None, delta, rho, "normal", nCGD, ve_max, nIter, WitnessInfo("tevaMorphosia_d0p1_r1_nCGD4", witness_ind))
Motion-Compensated Reconstruction (TevaMorphosia): the same call with deformation matrices
Tu, Tut, estimated from a first reconstruction (for instancex_cs) as described in the section Deformation-Fields of Reconstruction Calls:DF = ml.im_deform_field_chain_im_reg_demons23(x_cs, n_u, "curr_to_prev", 500, 1, None) Tu, Tut = ml.im_deform_field_to_sparse_mat(DF, N_u, None, True) x_motion = ml.teva_morphosia_chain(x_cs, None, None, y, ve, C, Gu, Gut, n_u, Tu, Tut, delta, rho, "normal", nCGD, ve_max, nIter, WitnessInfo("tevaMorphosia_motion", witness_ind))
The images are shown with ml.show_image: ml.show_image(x_cs) in the notebook (sliders
for the slice and the frame), ml.show_image(x0, "ortho") in a window with three linked slices
and a 3D view, and several reconstructions side by side in one window:
v = ml.show_image(x1, "window", name="gridded x1")
ml.show_image(x_sensa, viewer=v, name="Sensa")
ml.show_image([x_cs[i, 0] for i in range(nFr)], viewer=v, name="TevaMorphosia")
Tip
If the reconstruction is too memory demanding (OOM error), you can consider:
Reducing the matrix size (and the nominal resolution of the reconstruction)
Migrating to high computing resources, which might be needed for advanced reconstructions.
The memory bottleneck is the FFT computation.
Congratulations, you just completed your first reconstructions with Monalisa! You should be able to observe the magic of CS reconstructions, enhancing the image quality significantly. Observe how eye displacements become observable in the image reconstructed using TevaMorphosia.
Summary
This tutorial demonstrated the end-to-end workflow for reconstructing MRI data using Monalisa. From preprocessing to advanced reconstruction techniques, you now have all the tools to generate high-quality images. Experiment with the methods and parameters to optimize your results.
The coil sensitivity maps, binnings, mitosius and gridded reconstructions of the Python tutorial match those of the MATLAB tutorial up to single-precision rounding, see Validation: tutorial 1 end to end (Python port vs MATLAB).